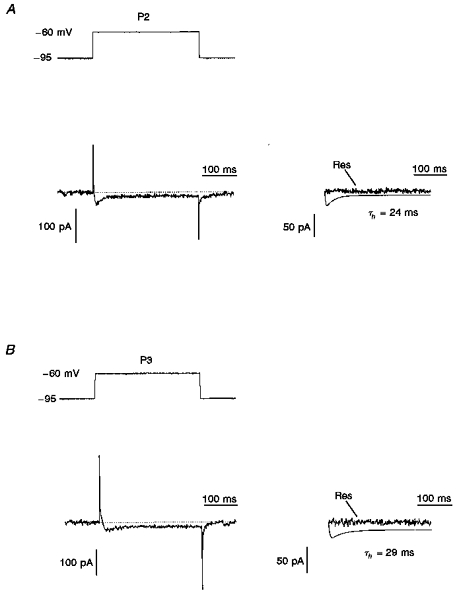
Figure 6. Inactivation kinetics of LVA Ca2+ currents in P2 and P3 visual cortical neurones.

A and B (left), a transient LVA Ca2+ current in P2 (A) and P3 (B) deep layer neurones activated by depolarization to -60 mV from a prepulse potential of -95 mV. A and B (right), the current traces were fitted by computer simulation using the m2h equation with the inactivation time constants (τh) indicated. The residue (Res) current was obtained by subtraction of the simulated current from the LVA Ca2+ current (control).
