
Figure 2. Intracellularly recorded activity of TC neurones during spontaneous SWDs.
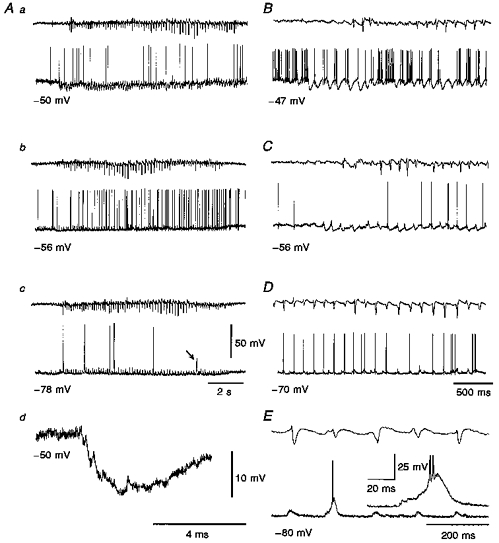
In this and following figures, the upper and lower trace in each pair are the EEG and the intracellular voltage record, respectively. A, examples of intracellular activity recorded during spontaneous SWDs in a TC neurone. Note the rhythmic EPSP/IPSP sequences at -50 mV (a) and how the IPSPs are fully reversed at -78 mV (c). The enlarged record in Ad clearly shows the EPSP/IPSP sequence. The tonic hyperpolarization is visible in Aa and b (cf. Fig. 3Aa-c), but not in Ac. The arrow in Ac indicates a LTCP that does not reach firing threshold. B-E, records from the same neurone as in A show that the firing is sculpted by the rhythmic synaptic potential sequences. In particular, at -47 mV (B) the activity consists of high frequency firing (around 100 Hz) intermixed with IPSP-mediated periods of inhibition, but no LTCP is present. At -56 mV (C), the firing is brought about by the EPSP/partially reversed IPSPs sequences. At -70 mV (D) the IPSPs are fully reversed but no LTCP is evoked. At -80 mV (E), the summation of the EPSP and reversed IPSPs provides a depolarization sufficient to elicit an LTCP with two action potentials (enlarged in the inset). Voltage calibration for the intracellular trace in Ac applies to all other intracellular traces except those in Ad and in the inset in E.