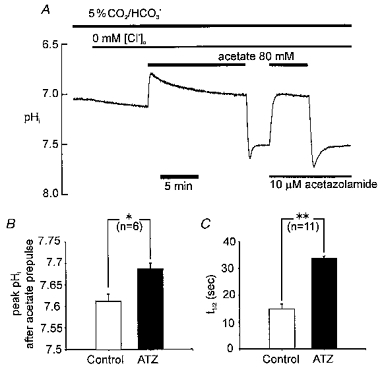
Figure 4. Rapid recovery is slowed by acetazolamide.

A, pHi recording showing experimental protocol. Cl−o was removed (replaced by gluconate) at the beginning of the recording (indicated by bar above trace) in order to inhibit Cl−o-dependent acid loading transporters. Note that pHi slowly rises as Cl− leaves the cell in exchange for HCO3− and OH−. B, histogram showing peak pHi following 80 mM acetate removal in Cl−-free solution in absence (control) and presence of 10 μM acetazolamide (ATZ) C, histogram showing time for 50 % recovery from peak pHi in absence (control) and presence of ATZ. * Significant difference, P < 0.05; ** significant difference, P < 0.001.
