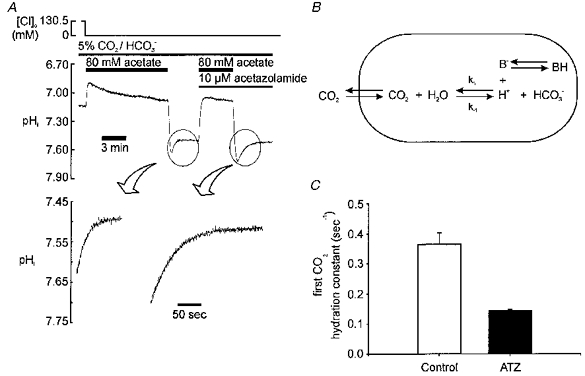
Figure 5. Measuring the rate constant for intracellular CO2 hydration, k1.

A, upper panel: sample experiment showing acetate prepulse with and without ATZ; lower panel: amplified sections of trace showing recovery phase with and without ATZ; continuous lines are fitted using the estimated value for k1, as described in the text and Appendix; correlation coefficient > 0.9999 (Student's paired t test). B, diagram of scheme assumed when calculating k1. CO2 has rapid access across sarcolemma. Hydration generates H+, most of which is buffered instantaneously by intrinsic buffers in the cell (B). C, histogram showing mean value of k1 derived from experiments like that shown in A, in absence (control) and presence of 10 μM ATZ.
