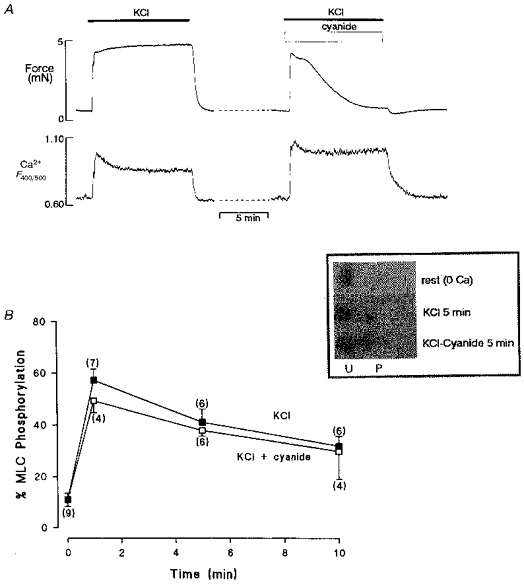
Figure 3. Changes in uterine force and myosin phosphorylation with cyanide.

A, simultaneous force (top) and Ca2+ (bottom) records showing the effect of hypoxia on a depolarized rat uterine preparation. Note the increased Ca2+ record in hypoxia, but the fall of force. B, MLC phosphorylation measurements during contraction for 10 min produced by high K+, in the presence and absence of hypoxia. There was no significant difference in the amount of MLC phosphorylation at any time point; mean data from densiotometric scans of silver stained 2-D gels (see inset). U, unphosphorylated; P, phosphorylated. Figure adapted from Taggart et al. 1997.
