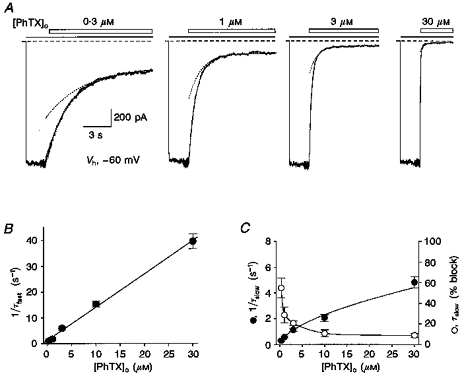
Figure 2. Fast and slow components of block by external PhTX.

A, responses from the same patch to 4 concentrations of PhTX (open bars) applied during responses to 50 μM domoate (filled bars). Dashed lines represent the holding current at -60 mV prior to application of agonist. The external solution contained 200 and 800 μM external Ca2+ and Mg2+, respectively, to improve patch stability. The apparent increase in noise preceding the response to PhTX is due to a change in sample clock frequency. Lines drawn through the data points are double-exponential functions fitted to the onset of block by external PhTX. Dotted lines show the exponential for the slow component of onset of block. The time constants were: 0.3 μM PhTX, τfast = 1.68 s, τslow = 4.12 s (53 %); 1 μM PhTX, τfast = 0.58 s, τslow = 1.36 s (43 %); 3 μM PhTX, τfast = 207 ms, τslow = 810 ms (26 %); 30 μM PhTX, τfast = 32 ms, τslow = 380 ms (9 %). B, rates for the fast component of onset of block (1/τfast) plotted against PhTX concentration; the continuous line shows a linear fit to mean values from 4 patches which gives an estimate for the association rate constant for PhTX at -60 mV of 1.3 × 10⁶ M−1 s−1. C, plot of PhTX concentration versus rate of onset of the slow component of block (1/τslow, •) and the percentage of the onset of block accounted for by the slow component (○) clearly demonstrates non-linear concentration dependence and suggests saturation at high concentrations of PhTX (lines connecting the data points have no significance).
