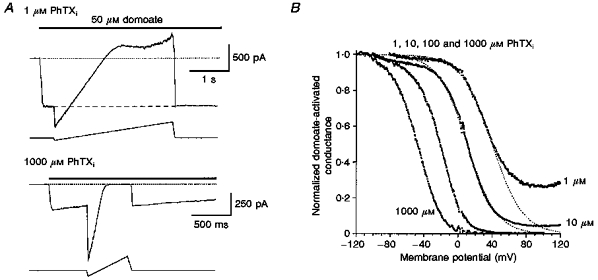
Figure 7. Low-affinity block by internal PhTX.

A, currents recorded in response to 50 μM domoate during voltage ramp protocols; the pipette solution contained PhTX at the indicated concentrations (internal PhTX, PhTXi) and no ATP. To maintain equilibrium block during changes in membrane potential, a slower ramp rate was required with 1 μM internal PhTX (-80 to +120 mV, 0.07 V s−1; upper panel) than with 1000 μM internal PhTX (-120 to +100 mV, 0.44 V s−1; lower panel). Holding potential, -60 mV. Traces are leak subtracted. Dotted lines represent zero current. Note the slow decline in the response to domoate at -60 mV observed with 1000 μM but not 1 μM PhTX. B, G-V curves for block by internal PhTX, normalized to the response recorded at the most negative membrane potential tested, for pooled data from 4 (1 μM), 8 (10 μM), 3 (100 μM) and 5 (1000 #181;M) patches, show a leftward shift with increasing PhTX concentrations (mean V½ values from Boltzman analysis are +41.5, +11.4, -22.6 and -50.4 mV, with slope factors of 18.4, 15.2, 13.5 and 14.0 mV−1 for 1, 10, 100 and 1000 μM PhTX, respectively). At positive potentials complete block was observed for both 1000 μM and 100 μM internal PhTX, whereas for 1 and 10 μM PhTX maximum block reached an asymptote and failed to increase with further depolarization. Dotted lines show the G-V relationships expected for a non-permeant blocker and represent fits of the Woodhull model of ion channel block to data points more negative than +40 mV for 10 μM PhTX and +30 mV for 1 μM PhTX.
