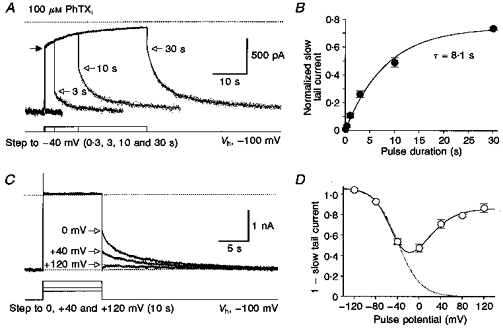
Figure 8. Tail current analysis of partial trapping by internal PhTX.

A, voltage steps from -100 to -40 mV for different durations reveal slow block by 100 μM internal PhTX of responses to 50 μM domoate. The voltage protocol is shown below a series of superimposed current traces recorded from the same patch. The dotted line represents zero current. The filled arrow on the left indicates the current amplitude at -40 mV predicted by analysis of ramp I-V relationships (Fig. 7). Lines through the data points are double-exponential functions fitted to the slow relaxations which followed the instantaneous increase in current on return to -100 mV (open arrows). The time constants of unblock, τfast and τslow, were (respectively): 2.2 s and 7.9 s (45 %) for 3 s steps to -40 mV; 2.3 s and 11.7 s (46 %) for 10 s steps; and 2.4 s and 12.1 s (47 %) for 30 s steps. B, the amplitude of the slow relaxation relative to the control response at -100 mV plotted against test pulse duration for observations from 6 to 7 patches per data point. Fitting an exponential function yielded a time constant of 8.1 s for the development of the slow component of block by internal PhTX. C, responses for voltage steps 10 s in duration from -100 mV to different test potentials as indicated; the upper dotted line shows zero current; because traces were not leak subtracted there was a small outward current at +120 mV which was the same value as that recorded during voltage ramps in the absence of agonist. Note that the amplitude of the slow component of recovery from block (open arrows) decreases with depolarization. D, biphasic voltage dependence for the slow component of block by 100 μM internal PhTX revealed by analysis of tail currents at -100 mV (mean values from 3 to 9 patches per data point). The amplitude of the slow component of the tail current at -100 mV was estimated by fitting exponentials to responses like those shown in C and extrapolating these to the time at which the membrane potential was returned from the test potential to -100 mV.
