
Figure 2. K+ currents in an intact neurone in the slice and in its isolated ‘soma’.
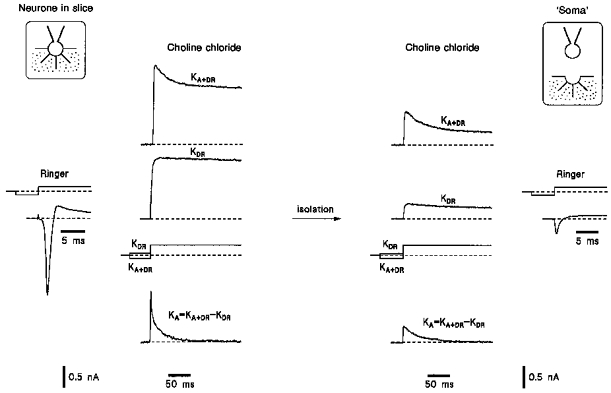
K+ currents were recorded in a neurone before and after its isolation according to protocols given in Fig. 1. The isolation resulted in the formation of a ‘soma’ configuration. Na+ currents were activated by a voltage step to -30 mV after a 50 ms prepulse to -120 mV.