
Figure 3. Activation characteristics of KA and KDR currents.
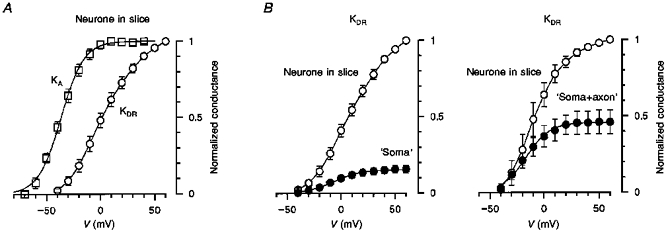
A, activation curves for KA and KDR currents recorded from intact neurones in slice (n = 13). The data points for KA current were fitted by the Boltzmann equation: 1/(1 + exp((V½ - V)/k)), where V½ = -37 ± 1 mV (the potential of half-maximal activation) and k = 11 ± 1 mV (a steepness factor). The data points for KDR currents were connected by straight lines. B, activation curves for KDR currents recorded before (○) and after (•) neurone isolation resulting in the formation of ‘somata’ (left, n = 19) and ‘soma+axon’ complexes (right, n = 4). The data points for KDR currents recorded in the slice were connected by straight lines and those for isolated structures were fitted with the Boltzmann equation with the following parameters: V½ = -6 ± 1 mV and k = 12 ± 1 mV for ‘somata’ and V½ = -17 ± 1 mV and k = 11 ± 1 mV for ‘soma+axon’ complexes.