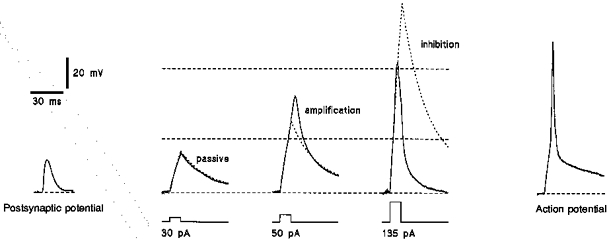
Figure 7. Membrane properties of ‘soma’.

Responses of a ‘soma’ to current pulses of increasing strength. Membrane potential of the ‘soma’ was kept at -80 mV. Passive membrane responses to different depolarizing pulses (dashed curves) were obtained in the following way: five responses to different hyperpolarizing pulses of -10, -20, -30, -40 and -50 mV were divided by factors of 1, 2, 3, 4 and 5, respectively, and then averaged. The averaged response was fitted with two exponentials (one for rising phase and one for decay). This fitted averaged response was supposed to be the passive membrane response to a hyperpolarizing -10 pA pulse. It was multiplied by the factors of -3, -5 and -13.5 giving the passive membrane responses to +30, +50 and +135 pA pulses, respectively. Horizontal dashed lines indicate the borders of passive, amplification and inhibition regions from Fig. 6B. A spontaneous postsynaptic potential and an action potential had been recorded from the same neurone in the slice before its ‘soma’ was isolated.
