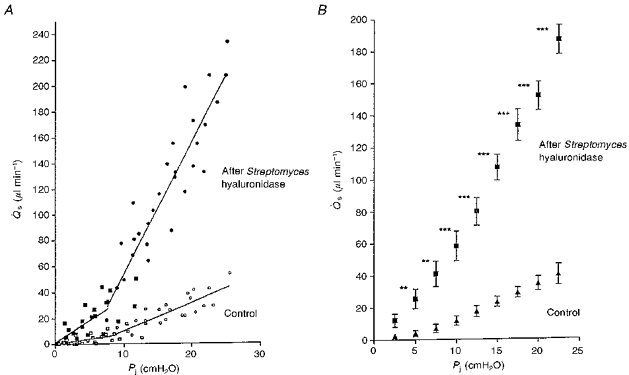
Figure 2. Effect of Streptomyces hyaluronidase on trans-synovial flow (Qs) at various intra-articular pressures (Pj) in 7 rabbits.

A, pooled results from control knee joints (open symbols) and contralateral joints after treatment with Streptomyces hyaluronidase (filled symbols). Square symbols show results below yield pressure (identified by inspection of individual plots) and circles show results above yield pressure. The regression lines are described in Table 1. B, means ± s.e.m. of flows interpolated to standard pressures for statistical comparison of control and post-enzymatic flows at the same pressure. * P = 0.05; **P = 0.01; ***P = 0.001 - Student's t test. The change in slope at yield pressure is blunted by this averaging process and is better seen in individual joints, as in Fig. 3.
