
Figure 1. Postnatal latencies of A fibre-evoked response.
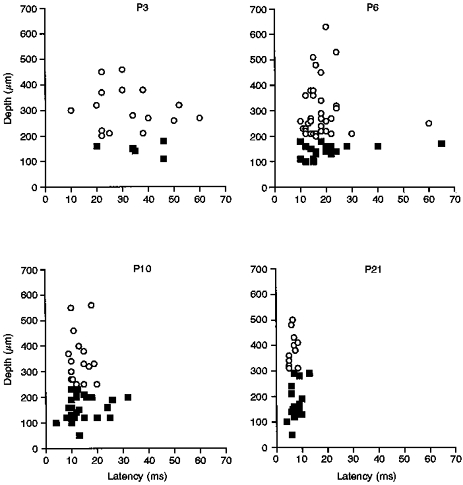
Scatter plots showing the latency of the A fibre-evoked response plotted against depth of the cell from the cord surface, for the different postnatal ages examined. ○, deep cells; ▪, cells in the superficial laminae. The mean latencies ( ± s.e.m.) for the deep cells at P3, P6, P10 and P21, respectively, were: 28.0 ± 4.5, 17.9 ± 1.2, 13.1 ± 1.0 and 6.45 ± 0.4 ms. The latencies for the superficial cells were: 36.3 ± 3.4, 19.4 ± 1.2, 13.7 ± 0.9, and 7.8 ± 0.5 ms, respectively.