
Figure 2. Postnatal variation in evoked latencies (s.d.).
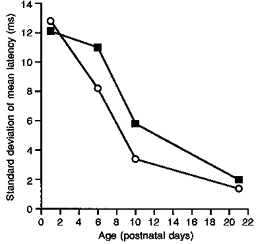
The change in variation of response latency in individual cells on repeated A fibre stimulation with postnatal age. The variation is expressed as the standard deviation of the mean latency for the population of cells at each age. ▪, cells recorded in superficial laminae; ○, cells recorded in deep laminae.