
Figure 4. Magnitude of evoked response.
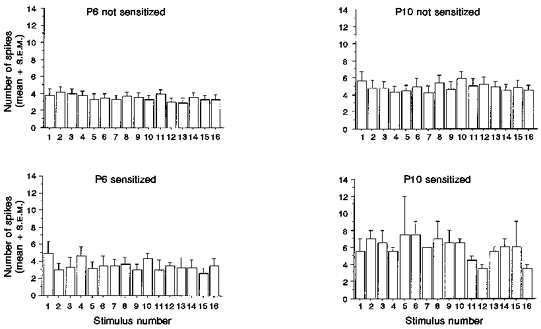
Bar charts representing the mean number of spikes (+s.e.m.) evoked by each stimulus in a train of 16 A fibre stimuli (twice threshold; 0.5 Hz). P6 and P10 cells are divided into those that sensitized on repeated A fibre stimulation and those that did not.