
Figure 9. The time courses of whole-cell K+ currents at hyperpolarized membrane potentials.
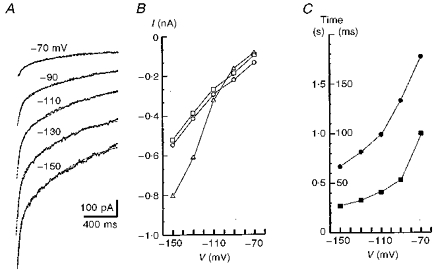
A, current traces measured after 4 min of hypoxia. The records were obtained after a 400 ms long prepulse to +50 mV (see Fig. 8) at potentials indicated near each trace. The dashed lines show the approximation of currents by a double-exponential function plus a constant term. B,○ and □ show the weights of slow and fast exponentials, respectively and ▵ indicates the offset value (steady-state current) in the approximating function. C,• and ▪ show the time constants for slow and fast exponentials, respectively (corresponding time scales are to the left and right of the y-axis). Presented are mean values averaged for 4 cells and standard deviations have been omitted for clarity.