
Figure 1. Schematic diagram of the connections of the model network.
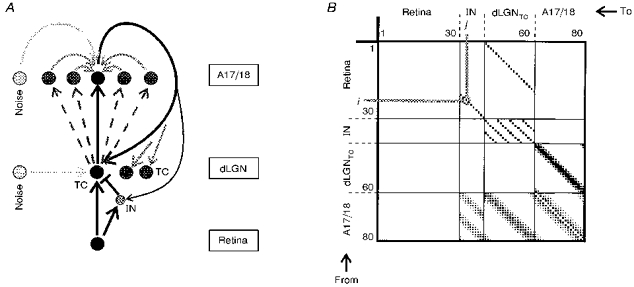
A, schematic set-up of the retino-thalamo-cortical pathway in the computer model. Projections and pathways are indicated by arrows. The spatial structure of the connections is depicted in the connection matrix shown in B for 80 cells in the retino-thalamo-cortical pathway. Each row and each column contains 80 entries, representing the connection from cell i(row i) to cell j(column j). The strength of a connection is encoded by a filled square at location (i, j), whose size corresponds to the strength of the projection from cell i to cell j.