
Figure 2. Effects of cortical cooling on the spike interval distribution of the tonic light response of dLGN relay cells.
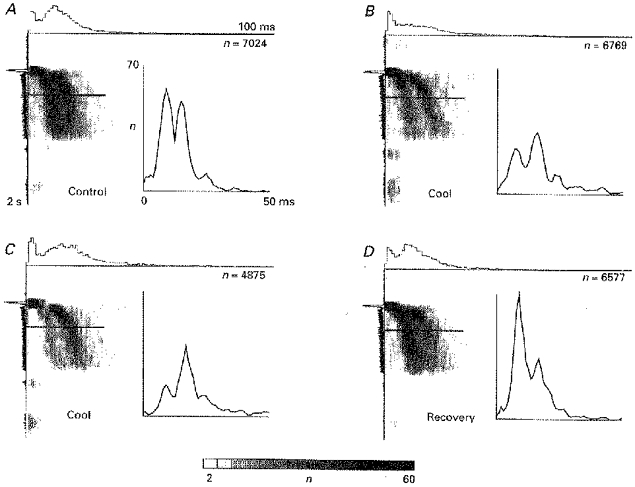
This figure shows the pre-analysis of the data by means of intervalograms and the final resulting temporally localized interspike interval histograms (ISIH, as insets) which are used throughout this study to display the results. One example of a series of intervalograms from a dLGN Y on-cell subjected to cortical inactivation by cooling (A-D) is shown. Number of intervals in each pixel line is coded by different grey levels with scale bar at the bottom. Total number of intervals (n) is given in the top right corner of each intervalogram. The regular ISIHs shown in the insets represent cross-sections through the intervalograms at the location indicated by the horizontal bar. Five adjacent pixel rows were averaged to obtain the ISIHs. The scaling for the insets is given in A, and kept constant for corresponding diagrams. The stimulus was a flashing dot of diameter, 1.0 deg and contrast, 0.9. Onset of the flash was after 400 ms and it was kept on for 800 ms followed by a pause of 800 ms. ISIHs were established from the responses to 100 stimulus repetitions. Start times of the respective recordings after start of cortical cooling were (min): B, 12; C, 34. For the recovery after stopping the inactivation: D, 13 min. The same conventions will be used for the timing notation in the other figures.