
Figure 3. Effect of changing EEG on dLGN spike interval distribution.
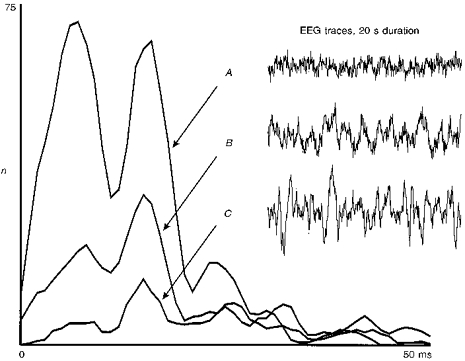
Example of an EEG effect observed at an X on-cell stimulated with a dot (size, 2 deg; contrast, 0.9). Traces on the right show a 20 s-long section (10 stimulus sweeps) of the simultaneously recorded EEG. A clear transition from a less-synchronized EEG (trace A) to a strongly synchronized EEG (trace C) is shown, where trace B represents an intermediate state. A strong change in the tonic (maintained) response component towards a dominance of the higher order peaks is observed the more synchronized the EEG becomes. Total number of intervals is (traces A-C): 8307, 6068, 4618.