
Figure 4. Scatter diagram distinguishing between experimentally induced effects and EEG-related observations by means of double-unit dLGN recordings.
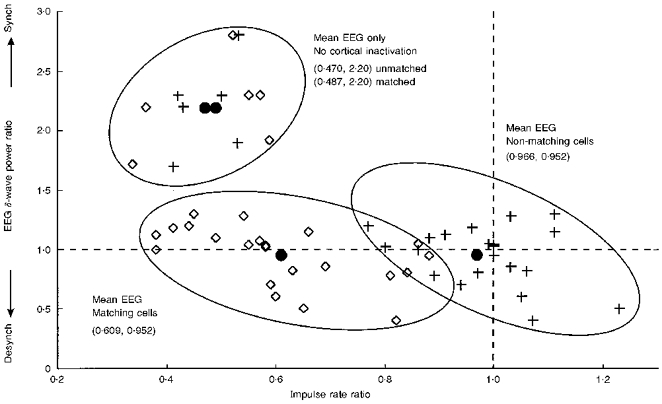
Symbols: ⋄, dLGN cells which match the cortical inactivation site; +, dLGN cells which do not match the cortical inactivation site; •, mean values of the cell groups. Three clusters can be observed. Cells in the top cluster were recorded without cortical inactivation; instead, cases are plotted where the EEG changed to a δ-wave-dominated state. EEG-related effects are clearly separate from effects observed during cortical inactivation (for further explanations see text). Synch, synchronized; Desynch, desynchronized EEG.