
Figure 7. Interaction of cortex inactivation with disinhibition of dLGN relay cells by Bicu.
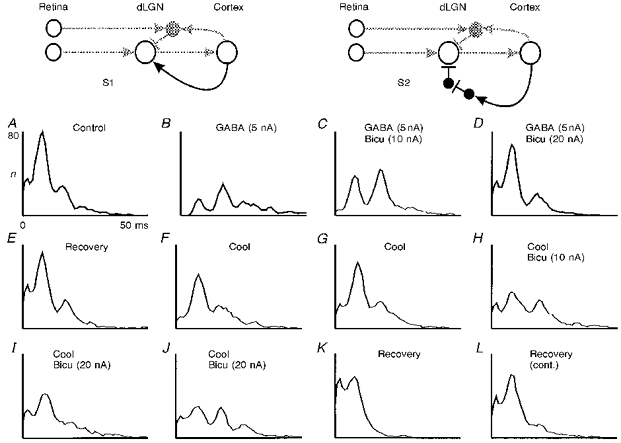
Simplified connection scheme of the primary visual pathway, showing the pathways for corticofugal facilitation (S1) or disinhibition (S2) stressed in black. A-L, combination of cooling the cortex and micro-iontophoresis of GABA and Bicu in the dLGN (Y on-cell; flashing spot stimulus; size, 2.5 deg; contrast, 0.9; single ejection barrels, ejection currents in nA, see figure). Recording times: B-D, starting immediately and continuing during drug application; E, immediate recovery after stopping the drug application; F, 28 min; G, 32 min; H, 36 min; I, 40 min; and J, 44 min after cooling onset; K, 15 min; and L, 18 min after termination of cooling. For other conventions see legend of Fig. 2. Total number of intervals n for the complete recordings (A-L): 8495, 4921, 7664, 8555, 8593, 6281, 6795, 7270, 7580, 7334, 8755, 8703.