
Figure 8. Broadening of dLGN interval peaks during cortex inactivation and comparison of retinal and dLGN spike interval distributions.
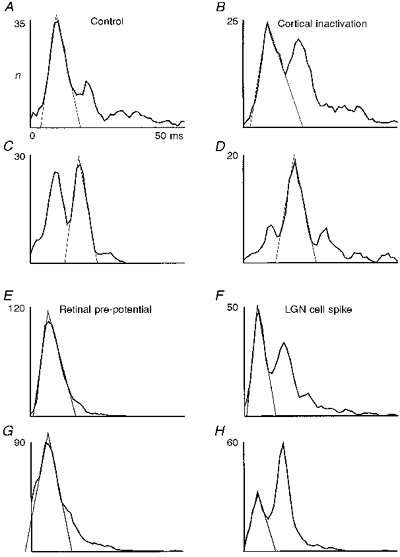
A-D, two ISIH pairs from dLGN cells before and during cortical inactivation. A and B, Y on-cell; C and D, X on-cell. Flashing spot stimuli size: A and B, 2.0 deg; C and D, 0.3 deg; contrast in all cases, 0.5. Recording times: B, 20 min; and D, 17 min after inactivation onset. Total number of intervals n for the complete recordings (A-D): 4375, 3643, 4120, 3511. E-H, ISIHs of 2 pairs of simultaneously recorded retinal pre-potentials and corresponding dLGN target cell spikes. Both recordings from X on-cells. Flashing spot stimuli: E and F: size, 1.0 deg; G and H: size, 0.3 deg; contrast in all cases, 0.9. Total number of intervals n for the complete recordings (E-H): 8656, 6797, 7711, 6812.