
Figure 10. Robustness of the model.
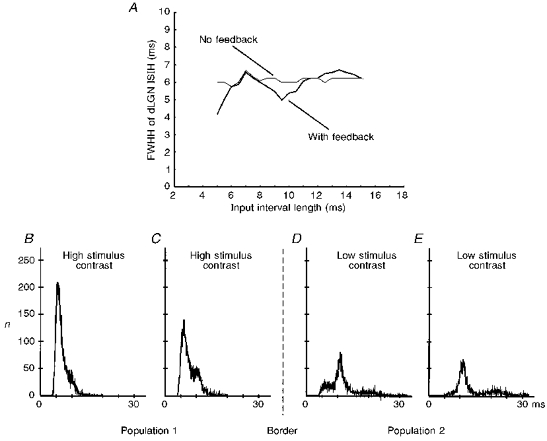
A, full width at half-height (FWHH) of the first interval peak averaged from 50 model dLGN cells with and without corticofugal feedback as a function of the changing retinal input interval length. Standard deviations are in all cases below 1 % of the measured value. Actually overlapping lines around the first peak in the diagram have been slightly displaced for graphical reasons. B-E, ISIHs of 4 simulated dLGN cells located in 2 different populations responding to 2 external stimuli of differing contrast. The cells form a linear stretch across the border of the 2 populations. Connections for all cells are homogeneous and overlapping for the 2 populations. In particular, there is a thalamo-cortical projection that extends over 5 cells, an intracortical projection to 9 cells, and a cortico-thalamic back-projection of a single cortical cell to 7 dLGN cells, with a relative synaptic strength of 2:1:1, respectively. All projections are topographic and the spatial weighting functions are truncated Gaussian functions.