
Figure 2. Distribution of motor unit tetanic forces in normal and reinnervated muscles.
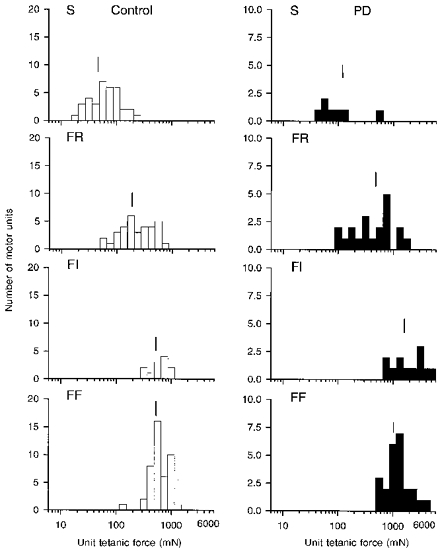
Frequency histograms of tetanic force developed by FF, FI, FR and S units sampled in 2 normal and 2 partially denervated (PD) muscles innervated by ≈20 % (mean ± s.e.m., 19.8 ± 3.7 %) of its normal complement of motor units. The force of all 4 motor unit types increased significantly in partially denervated muscles, but the range remained the same. Mean values are indicated by the vertical line to show that S < FR < FI = FF in normal and partially denervated muscles.