
Figure 4. Distribution of motor unit half-fall times in normal and reinnervated muscles.
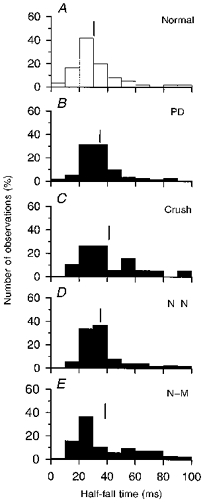
Frequency histograms of motor unit half-fall times in normal (A), partially denervated (B) and reinnervated muscles after nerve crush (C), N-N (D) or N-M sutures (E). Motor units were sampled from the same muscles as in Fig. 3. Means are shown by vertical lines and are ( ± s.e.m.; in ms): 30.2 ± 2.1 (A), 38.2 ± 2.1 (B), 39.6 ± 3.3 (C), 40.7 ± 2.3 (D) and 42.7 ± 2.1 (E).