
Figure 9. Relationship between axon potential amplitude and twitch contraction time with unit tetanic force.
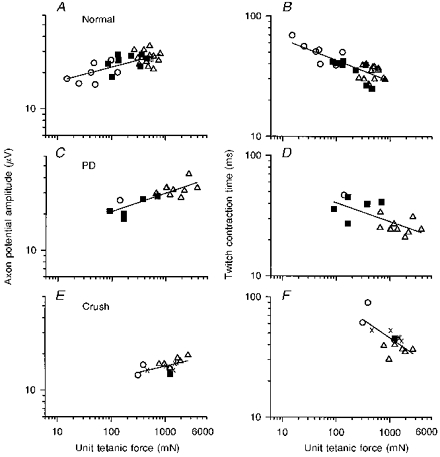
Axon potential amplitude and twitch contraction time plotted as a function of tetanic force in motor units from normal (A and B), partially denervated muscle innervated by 25 % of its motor units (C and D), and muscles reinnervated after nerve crush by 25 % of its motor units (E and F). ○, S units; ▪, FR units; ▵, FI and FF units;, unclassifiable units. The slopes ( ± s.e.) of the regression lines for axon potential amplitude and tetanic force (0.12 ± 0.02, 0.15 ± 0.03 and 0.19 ± 0.06; r = 0.60, 0.83 and 0.53, respectively) are all significantly different from zero (P < 0.01-0.05) and not different from each other. The negative slopes of the regression lines for contraction time and tetanic force (0.14 ± 0.02, 0.16 ± 0.05 and 0.28 ± 0.07; r = 0.66, 0.68 and 0.70, respectively) are also significantly different from zero. Slopes of B and D are not different from each other; however, the slope in F is significantly steeper.