
Figure 11. Size relationship between axon potential amplitude and unit tetanic force when reinnervated by few or many motoneurones.
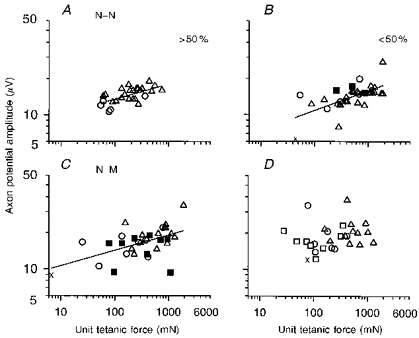
Axon potential amplitude plotted as a function of tetanic force in motor units from muscles reinnervated by > 50 % and < 50 % of their normal complement of motor units after N-N (A and B, respectively) or N-M sutures (C and D, respectively). Unit types denoted by same symbols as in Fig. 9. Muscles in A, B, C and D were reinnervated by 88, 32, 88 and 31 % of their motor units, respectively. The slopes ( ± s.e.) of the regression lines in A-C(0.13 ± 0.03, 0.13 ± 0.03 and 0.12 ± 0.02; r = 0.63, 0.58 and 0.67, respectively) are all significantly different from zero (P < 0.01-0.05) and not different from each other or from normal (Fig. 9A). The regression line fitted to the values in D is not significantly different from zero (P < 0.05) and therefore has not been drawn.