
Figure 8. α7 deletion also removed the long τ 50 pS and native 35 pS channels.
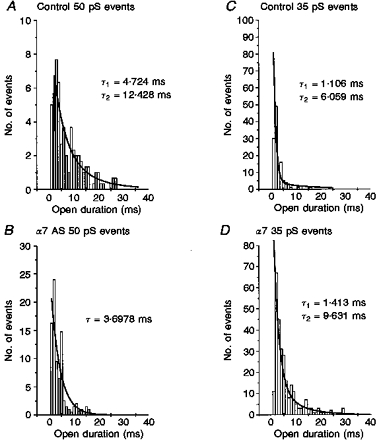
The open time kinetics of individual conductance classes were analysed from single channel records obtained from the control (mismatch or sham treatments) and α7 minus neurones. The distribution of burst duration for each conductance was best fitted by one or the sum of two exponentials, as noted, thus indicating one or more open time constant (τopen). A, burst duration distribution for all openings at 50 pS under control conditions (control oligonucleotide treatment) are best fitted by the sum of two exponential curves, indicating fast and slow open time constants of τfast = 4.7 ms and τslow = 12.4 ms, respectively. B, burst duration distribution of all openings at 50 pS detected in neurones treated with α7 antisense oligonucleotides. The open duration histogram is best fitted by a single exponential with τ = 3.7 ms, equivalent to the fast τ 50 pS opening in control neurones. Thus the long open duration 50 pS channels were deleted by α7 antisense treatment. C and D, comparison of the burst duration distribution of all 35 pS channel openings in control vs.α7 minus neurones. The 35 pS conductance channels recorded in α7 minus neurones differed from native 35 pS channel openings in their open kinetics. While the native 35 pS channels include two open states with τ values of 1 and 6 ms (1.06 ± 0.32 ms and 7.07 ± 2.22 ms, all control data), the 35 pS channels in α7 minus neurones are described by τopen of 1.4 and 9.6 ms (1.51 ± 0.289 and 10.97 ± 2.53 ms, all α7 minus data; n = 6). This analysis suggests that the native 35 pS channel is absent in α7 minus neurones (see Discussion and Appendix to accompanying paper, Yu & Role, 1998).