
Figure 3. Characteristics of the running step at the different ages and speeds.
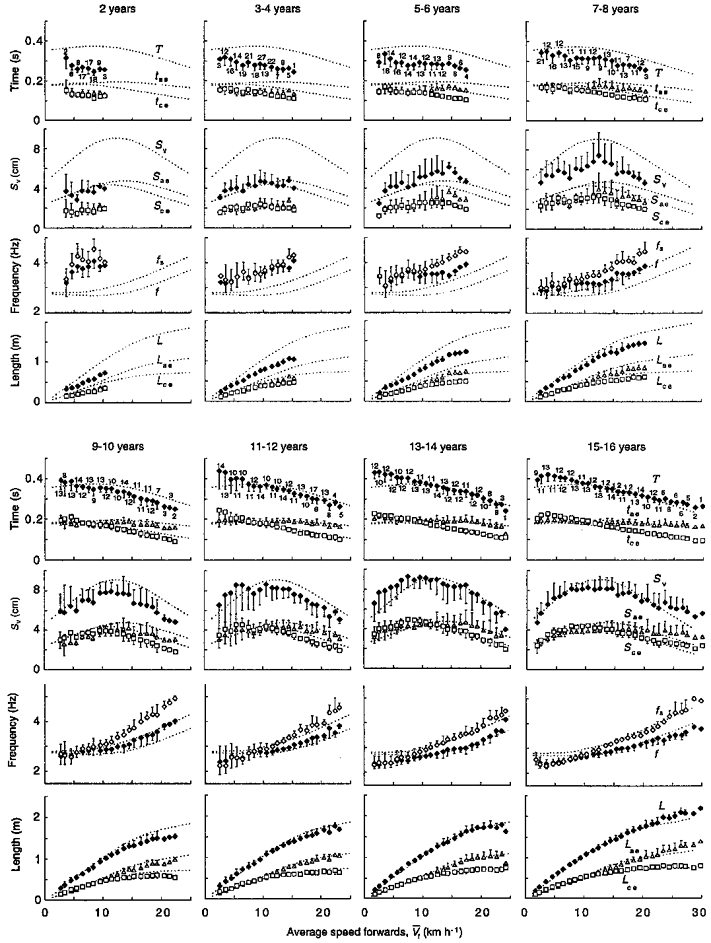
In each age group (see Table 1), ♦ indicate, from top to bottom, the step period (T), Sv, the freely chosen step frequency (f = 1/T) and the step length (L = TVf) as a function of the mean running speed (V¯f). ▵ indicate tae and the displacement of the centre of mass during this phase in the vertical direction (Sae) and in the forward direction (Lae). Similarly, □ indicate tce and the corresponding displacements during this phase in the vertical direction (Sce) and in the forward direction (Lce). ⋄ indicate the natural frequency of the elastic system (fs), calculated using eqn (4) from the stiffness measured as described in the Methods. The points represent the mean values ( ± s.d., n is given by the number near the symbols) of data grouped, when applicable, into the following intervals along the abscissa: 1 to < 2, 2 to < 3,…., 29 to < 30 km h−1. Note that the range of speeds is smaller in children than in adults. Error bars, indicating s.d., are drawn when they exceed the size of the symbol. Note that the point at the maximal speed attained in the 3-4, 13-14, and 15-16 years classes is a single datum; in the 13-14 years class this point exhibits an exceptionally low vertical displacement and acceleration (see Fig. 5). The dotted lines indicate the adults trend determined by averaging data of the present study (bottom row in Table 1) with those of Cavagna et al. (1988). Note that in spite of the fact that f is higher and L is lower in children than in adults, fs diverges from f at about the same speed (≈11 km h−1), independent of age.