
Figure 1. α5 deletion increases the nAChR sensitivity to agonist.
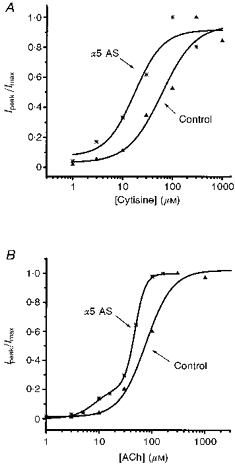
The peak amplitude of the currents (Ipeak) evoked by the indicated concentrations of either ACh or cytisine were measured and normalized to the maximal response (Imax) (maximal [ACh], 500 μM; maximal [cytisine], 300 μM). An average of two to seven amplitudes are plotted as a function of the agonist concentration. ▴, data from the control neurones; ⋆, data from α5 minus neurones. A, the dose-response curve for cytisine in control neurones was fitted as a simple sigmoidal curve indicating an EC50 of 61.6 μM and an apparent Hill coefficient of 1.29. In α5 minus neurones the cytisine dose-response curve indicated an EC50 of 17.3 μM and an apparent Hill coefficient of 1.57. B, dose-response curves to ACh. ▴, data from control neurones; ⋆, data from α5 minus neurones. Under control conditions, the concentration dependence of ACh-evoked currents was sigmoidal with an EC50 of 76.6 μM and an apparent Hill coefficient of 1.74. Following the deletion of α5, two components of the ACh dose-response curve were resolved: one with an EC50 of 8.47 μM and the other with an EC50 of 47.48 μM. The apparent Hill coefficient for ACh was 2.63.