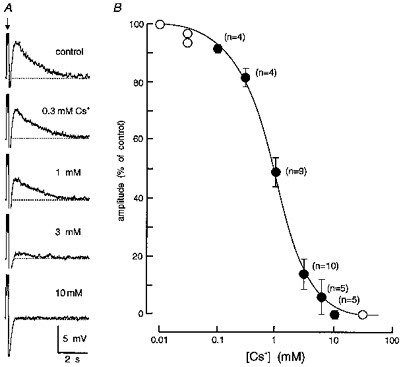
Figure 3. Inhibition of DAPs by Cs+ is dose dependent.

A, excerpts of an intracellular recording obtained from an MNC in which DAP amplitude was examined under control conditions and in the presence of different concentrations of Cs+ (as indicated). The traces are aligned vertically along the time at which a train of 3 spikes (clipped amplitude) was evoked (arrow) by a current pulse to elicit a post-train DAP (dashed line, −62 mV). The full amplitude of the AHP is not shown, except for the trace recorded in 10 mM Cs+. B, the graph plots the relative amplitude of DAPs (% of control) recorded from MNCs during bath application of different concentrations of Cs+. Note that half-maximal inhibition occurred near 1 mM. Open symbols plot data obtained from single cells whereas filled symbols show means ± s.e.m. The number of cells from which the mean was calculated is shown in parentheses beside each point.
