
Figure 5. Blockade of the DAP enhances the overlapping AHP.
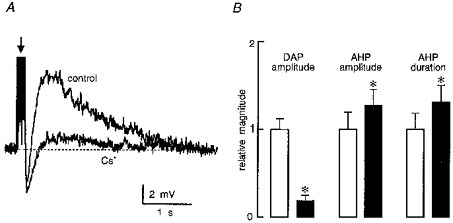
A, superimposed traces showing post-train (arrow; spike amplitude not shown) after-potentials comprising AHP (below the dashed line) and DAP (above the dashed line) components, recorded in the absence (control) and presence (Cs+) of 3 mM extracellular Cs+. B, bar histograms illustrating mean (+ s.e.m.; n = 11) relative changes in DAP amplitude, AHP amplitude and AHP duration, during application of 3-6 mM Cs+. □, control; ▪, Cs+. Note that * indicates P < 0.05 (see text for absolute values).