
Figure 2. Mitochondrial respiratory rate before and after prolonged exhaustive exercise.
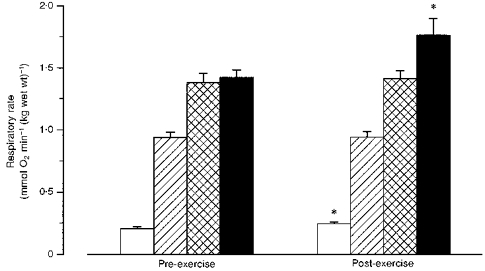
Values are means ± s.e.m. □, 0 mM ADP;  , 0.1 mM ADP;
  , 1 mM ADP; ▪, 0.1 mM ADP + 20 mM creatine. * Significantly different from pre-exercise (P < 0.01,n = 10).