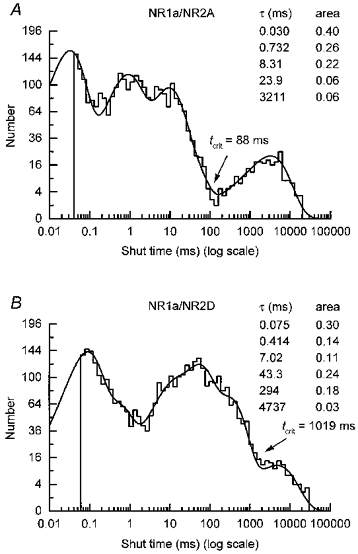
Figure 2. Shut-time distributions for NR1a/NR2A and NR1a/NR2D channels.

A, shut-time distribution for glutamate-activated NR1a/NR2A channels (100 nM + 20 μM glycine, same experiment as shown in Fig. 1A) fitted with a mixture of five exponentials with means (and areas) of 30 μs (40 %), 732 μs (26 %), 8.31 ms (22 %), 23.9 ms (6 %) and 3211 ms (6 %). The fit predicts 4302 events and 2960 were included in the distribution, which has an overall mean of 183 ms. B, shut-time distribution for NR1a/NR2D channels activated by glutamate (30 nM + 20 μM glycine, same experiment as illustrated in Fig. 1B). The distribution is fitted with a mixture of six exponentials with means of 75 μs (30 %), 414 μs (14 %), 7.02 ms (11 %), 43.3 ms (24 %), 294 ms (18 %) and 4737 ms (3 %); 4568 events were predicted by the fit and 3734 events were included. The overall mean of the distribution is 225 ms.
