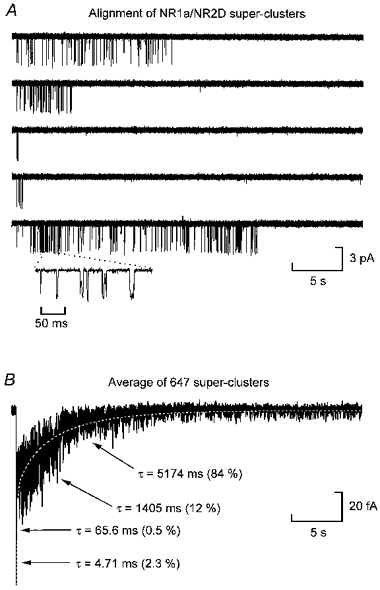
Figure 5. Alignment of NR1a/NR2D super-clusters.

A, examples of NR1a/NR2D super-clusters from an experiment that gave a tcrit of 1019 ms (same experiment as Figs 1B and 2B). Like their NR1a/NR2A counterparts, NR1a/NR2D super-clusters can be comprised of only a few openings (third trace) but in contrast to NR1a/NR2A super-clusters, they can last for many seconds. Each of these traces show 35 s of activity. They also show periods of ‘high Popen’ (bottom trace). The inset below the final super-cluster shows a 200 ms section of one of these ‘high Popen’ periods on an expanded time-base. Overall, however, the Popen of NR1a/NR2D super-clusters is about 10-fold less than NR1a/NR2A super-clusters. B, average of 647 NR1a/NR2D super-clusters fitted with a sum of exponential components where the time constants have been fixed to those obtained from the fit of the distribution shown in Fig. 3B. The peak of this trace is truncated in this panel to allow clearer illustration of the slow decay of the current. This trace is digitally filtered at 50 Hz for illustration.
