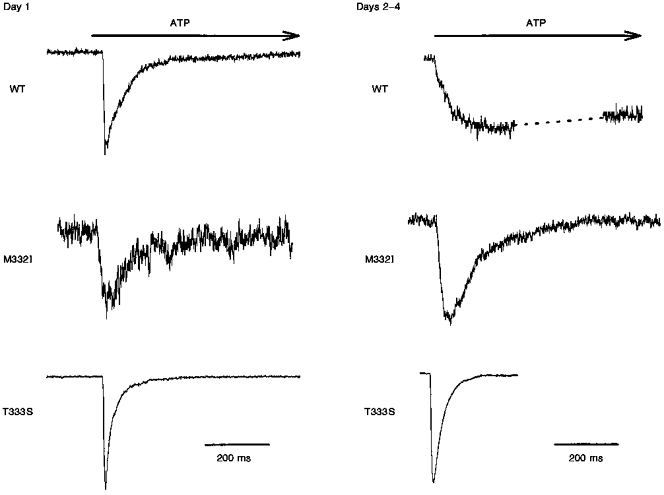
Figure 3. Wild-type and mutant P2X1 responses to ATP.

A comparison of the responses of wild-type and mutant P2X1 receptors to 1 s application of 30 μM ATP on the first and subsequent days after passage. The holding potential was −40 mV. The wild-type response shown for days 2-4 is the same shown for day 3 in Fig. 1. Peak current responses were as follows. Day 1: wild-type, 100 pA; M332T, 40 pA; T333S, 310 pA. Days 2-4: wild-type, 35 pA; M332T, 60 pA; T333S, 1075 pA.
