
Figure 2. Inactivation of KvLQT1 channels assessed by tail current analysis.
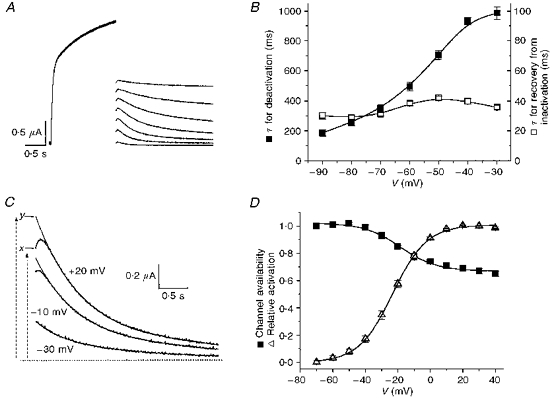
A, currents were activated with 1.6 s pulses to +20 mV; tail currents were elicited by hyperpolarizing pulses to voltages ranging from -90 to −30 mV. B, time constants of recovery from inactivation (for initial increase in current) and deactivation (slow decline) of KvLQT1 channel current (n = 16). C, tail currents measured at −70 mV after a 2 s pulse to -30, -10 and +20 mV. Tail currents were fitted with a single-exponential function between 0.2 and 1.0 s after repolarization. Initial current (x), and extrapolated (y) currents are indicated for the current measured after the pulse to +20 mV. D, voltage dependence of KvLQT1 channel inactivation. Initial tail current amplitude was divided by extrapolated amplitude to obtain the relative value (x/y) of channel availability (▪). Data were fitted with a Boltzmann function to determine the V0.5 (-18.3 ± 1.8 mV) and slope factor, k, (11.2 ± 1.7 mV) of the relationship (n = 18). The voltage dependence of activation (▵) is shown for comparison (V0.5 = -23 ± 0.4 mV; k = 10.6 ± 0.3 mV; n = 18).