
Figure 3. The onset of KvLQT1 channel inactivation is delayed.
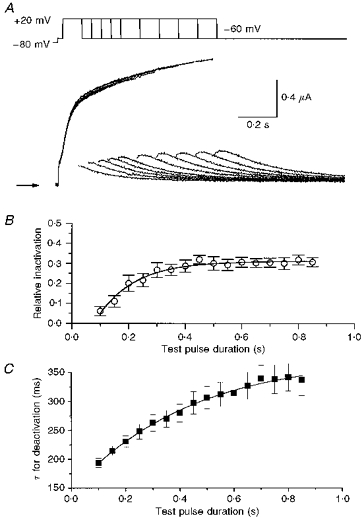
A, superimposed currents recorded during pulses of variable duration (0.1-1.6 s, in 0.1 s increments) to a potential of +20 mV, followed by a test pulse to −60 mV to elicit tail currents. Arrow indicates zero current. B, the fraction of inactivated channels (1 - x/y) was estimated by tail current analysis as described in Fig. 2C. Following an initial delay of ≈75 ms, inactivation proceeded monoexponentially (τ = 130 ± 10 ms; n = 6). C, time constants for decaying tail currents using pulse protocol in A are plotted against preceding pulse duration (n = 6).