
Figure 3. Relationship between [K+]o and the membrane potential of choroidal arterioles.
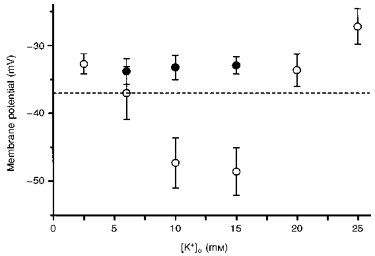
In control solutions (○) the membrane potential was about −37 mV; when [K+]o was increased to either 10 or 15 mM, the membrane hyperpolarized. At higher values of [K+]o the steady-state value of membrane potential was more positive than that detected in control solutions. Prior addition of 50 μM Ba2+ (•) prevented the hyperpolarizations produced by [K+]o (10 and 15 mM). The vertical bars represent ± s.d. (n = 4-25) and the dashed horizontal line indicates the membrane potential recorded in [K+]o = 5.9 mM.