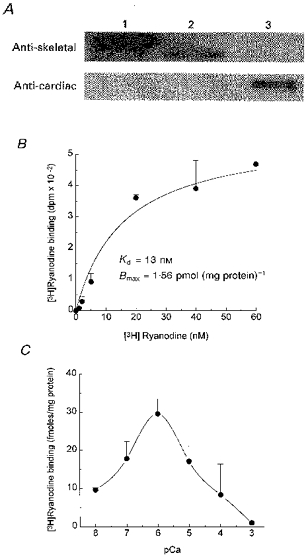
Figure 1. Immunoblot analysis and [3H]ryanodine binding to cortical microsomes of sea urchin eggs.

A, Western blot analysis with RyR antibodies. Cortical microsomal proteins and cardiac and skeletal SR microsomes were separated by SDS-PAGE, transferred to a nitrocellulose membrane, and probed with a rabbit monoclonal skeletal RyR antibody and cardiac RyR antibody, as indicated. Lane 1, 30 μg rabbit skeletal microsomes; Lane 2, 50 μg sea urchin egg microsomes; Lane 3, 30 μg pig cardiac microsomes. B, [3H]ryanodine saturation binding curve. Between 1 and 10 μg of L. pictus cortical microsomes were incubated with the indicated concentration of [3H]ryanodine as indicated in Methods. Non-specific binding has been subtracted from each data point. Data were fitted with the equation: B = Bmax [ [3H]ryanodine]/(Kd + [ [3H]ryanodine]), where B corresponds to specific binding of [3H]ryanodine, Bmax is the maximal density of receptor sites and Kd is the apparent dissociation constant of the [3H]ryanodine-RyR complex. C, Ca2+ dependence of [3H]ryanodine binding to sea urchin egg microsomes. Binding conditions were as in B except that 1 mM EGTA and varying concentrations of CaCl2 were added to the medium to bring [free Ca2+] to the specified level. [3H]Ryanodine concentration was 7 nM.
