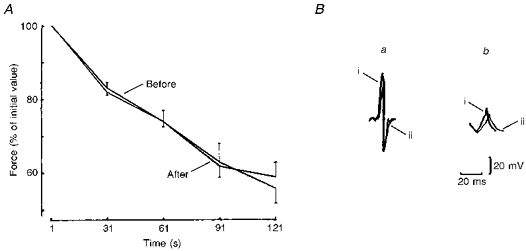
Figure 3.

A, changes in force during 60 intermittent 1 s electrically evoked contractions, separated by 1 s intervals, in control conditions and after 7 days of dry water immersion. Values are expressed as the percentage of initial tetanus force (50 impulses s−1). B, last surface action potentials recorded during the 1st (a) and 60th contractions (b) in control conditions (i) and after 7 days of dry immersion (ii).
