
Figure 8. Fura-2 fluorescence in nasal epithelial cells.
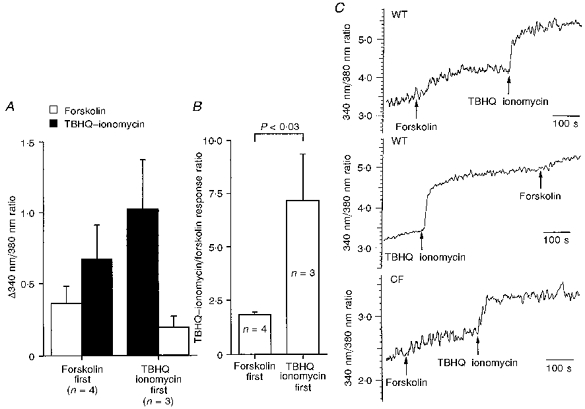
A, effects of forskolin (10 μM) and TBHQ-ionomycin (12.5 μM and 5 μM, respectively) on [Ca2+]i indicated by the 340 nm/380 nm ratio in fura-2-loaded tissues. B, ratio of the response to TBHQ-ionomycin to that for forskolin depends on the order in which the agents are given. The ratio is significantly greater when TBHQ-ionomycin are given first. C shows examples of 340 nm/380 nm ratios for preparations from wild-type nasal epithelia (top and middle traces) and from a CF preparation (bottom trace).