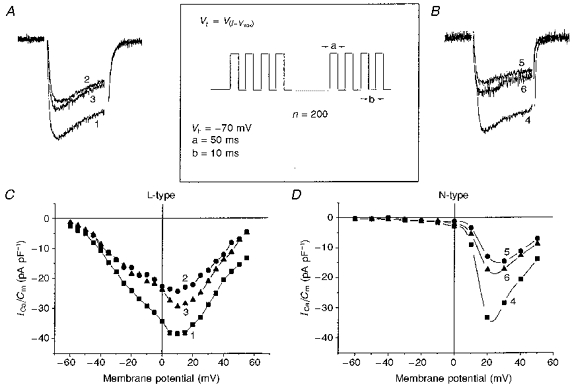
Figure 3. Effects of high-frequency stimulation (HFS) on HVA VOCCs.

I-V recordings of pharmacologically separated L-type VOCCs with 1 μM ωCgTX GVIA in the presence of 0.1 mM Ni2+ in bath solution (A and C) and N-type VOCCs with 10 μM nifedipine (B and D) were obtained in control conditions (curves 1 and 4), immediately after HFS (curves 2 and 5) and 5 min after HFS (curves 3 and 6) in two different cells. Bath solution contained 0.1 mM Ni2+. Inset shows the HFS protocol for the experiment, where Vt is test potential corresponding to I-Vmax.
