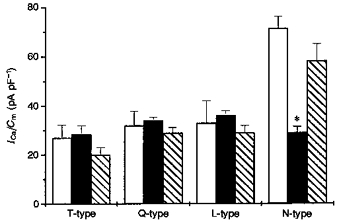
Figure 9. Sensitivity of different Ca2+ current components to PP2B overexpression in differentiated NG108-15 cells.

The mean ±s.d. peak amplitude of Ca2+ current evoked by test potentials from Vh = −80 mV to −20, −15, 0 and +20 mV corresponding to the peak of I-V curves of T-, Q-, L- and N-type channels for given experimental conditions (10 mM Ca2+in bath solution) without blockers are presented for wild-type (□), sense (▪)- and antisense ( )-transfected cells. Each histogram value represents the values calculated from data presented in Fig. 8. *P < 0·0002 with respect to control.
