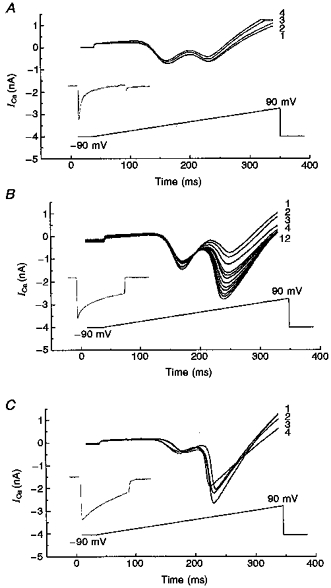
Figure 10. Expression of Ca2+ channels in differentiated sense NG108-15 transfectants (CN-15).

A, leak-subtracted membrane current recorded in control bath solutions in CN-15 transfectants in response to voltage ramps from holding potential of −90 mV to peak potential of +90 mV during 0.5 s steps in control conditions (a ramp rate of 0.36 V s−1). B, ramps recorded in the presence of 10 mM EGTA in pipette solution from CN-15 cells. C, ramp recordings obtained in the presence of 35 μM FK-506 from CN-15 cells. Numbers adjacent to the curves indicate the sequence of trace recordings with respect to time. Insets show the current traces normalized to their peaks that were induced by 500 ms pulses of depolarization corresponding to the peak (+20 mV) of the I-V curve.
