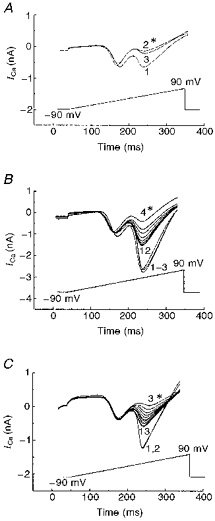
Figure 11. Recovery of VOCC inhibition induced by HFS of transfected (CN-15) cells during suppression of PP2B activity.

Leak-subtracted membrane current recorded in response to application of voltage ramps from holding potential of −90 mV to peak potential of +90 mV during 0.5 s steps in control condtions (A), in the presence of 10 mM EGTA (B) and 35 μM FK-506 (C) in the pipette solution are shown for transfected CN-15 cells, in control bath solution without any blockers. Numbers near the curves indicate sequence of trace recording in time and traces recorded immediately after HFS marked by asterisks with the exception of trace 3 in A, which corresponds to traces obtained at the same time after patching as traces 12 in B and C.
