
Figure 4. Effects of various P2 receptor antagonists on the response to ATP.
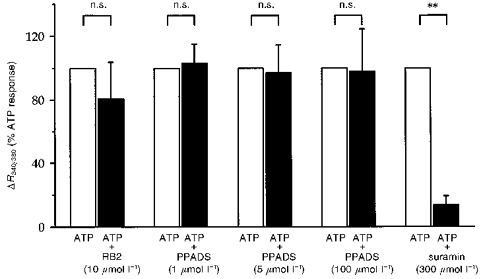
The effect of each indicated compound on the response to 100 μmol l−1 ATP was observed and quantified as for Fig. 3. Results are given as means and s.e.m. are represented by vertical bars (n ≥ 4 for all conditions). n.s., not significantly different from ATP. **P < 0.01vs. ATP.