
Figure 6. Effect on basolateral membrane potential of ATP (100 μmol l−1), added to a basolateral Ringer perfusion.
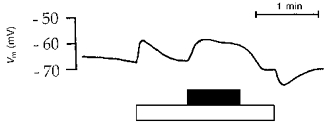
Tracing obtained with an intracellular microelectrode. Timing of perfusion with experimental solutions is indicated by horizontal bars below the graph: filled bar, 100 μmol l−1 ATP; open bar, Ringer solution. Before and after these experimental solutions, perfusion was with blood from normal circulation. In this experiment, ATP induced a sustained membrane depolarization.