
Figure 8. Effect on basolateral membrane potential of repeated ATP (100 μmol l−1) exposure.
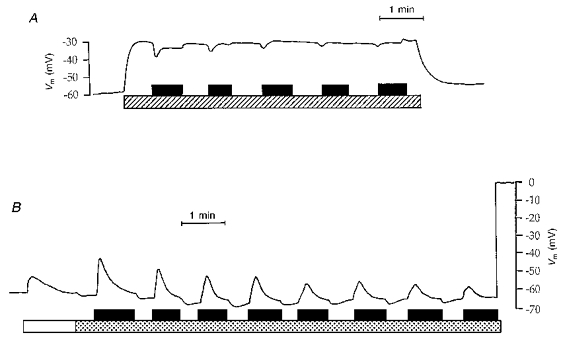
Tracings obtained with intracellular microelectrodes. Timing of perfusion with experimental solutions is indicated by the horizontal bars. In A, ATP was added to a BaCl2-containing Ringer solution. Hatched bar, Ringer solution + 2 mmol l−1 BaCl2; filled bar, 100 μmol l−1 ATP. In B, ATP was added to a low Cl− solution. Open bar, Ringer solution; stippled bar, low Cl− solution; filled bar, 100 μmol l−1 ATP. Before and after these experimental solutions, perfusion was with blood from normal circulation.