
Figure 1. Force and [Ca2+]i measured simultaneously in response to [Ca2+]o.
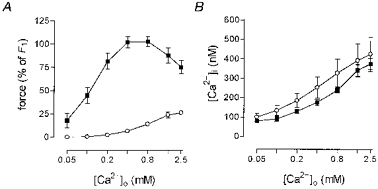
A, force relative to control force, F1, in response to cumulative increasing [Ca2+]o in K-PSS (^, 125 mM K+) and NA-K-PSS (▪, K-PSS plus 10 μM noradrenaline) in intact rat mesenteric small arteries. B, from the same experiments; simultaneous measurements of [Ca2+]i using fura-2 plotted against [Ca2+]o. The [Ca2+]i recorded is the mean concentration in the last 20 s of a stimulation period of 3 min. Error bars indicate s.e.m. (n = 4).